How to make a great graphical abstract
I’m sure that you at least once were demanded by a journal to make a graphical abstract for one of your publications. This is often viewed as something mandatory and many researchers reuse a figure from the paper for this purpose. However, I think that you can make your paper stand out by making a great graphical abstract. In this blog post I will show how you can make a graphical abstract and with a few simple steps improve it to make it really great.
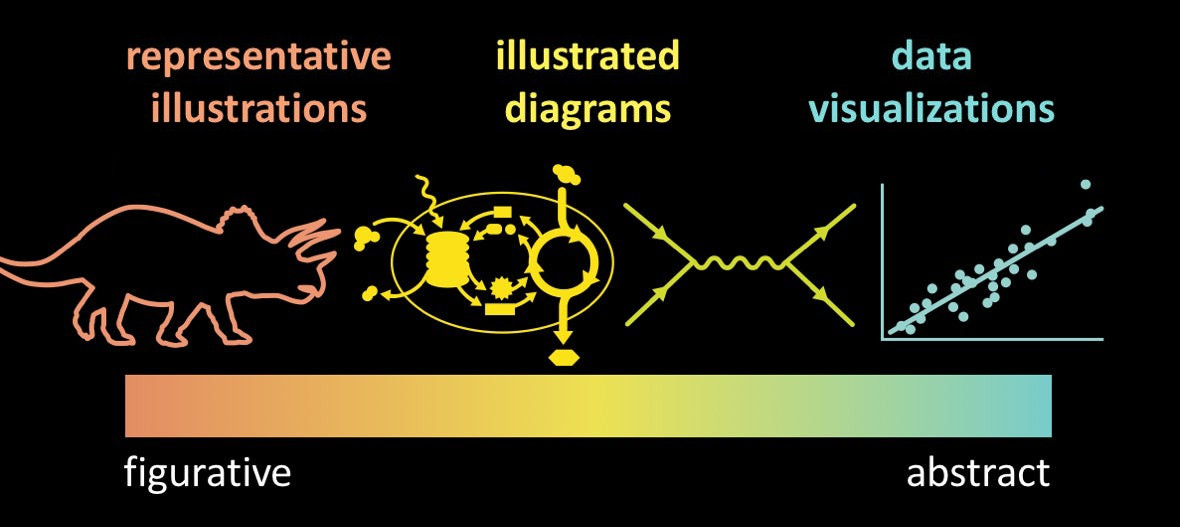
So what is a graphical abstract? Well actually, you can see it as an infographic. There are different types of infographics, which can be placed on a continuum ranging from figurative to abstract representations. The figure below shows this continuum with some illustrative examples. At the figurative end we see visual representations of dinosaurs, followed by schematizations of processes and representations of mathematical expressions. At the end we see the data visualizations you are more familiar with, which are the actual data plots you would use in your publication. The continuum can be subdivided into three categories: (1) representative illustrations, (2) illustrated diagrams and (3) data visualizations. For graphical abstracts we should mostly focus on illustrated diagrams, but can include some of the other two categories, as well.
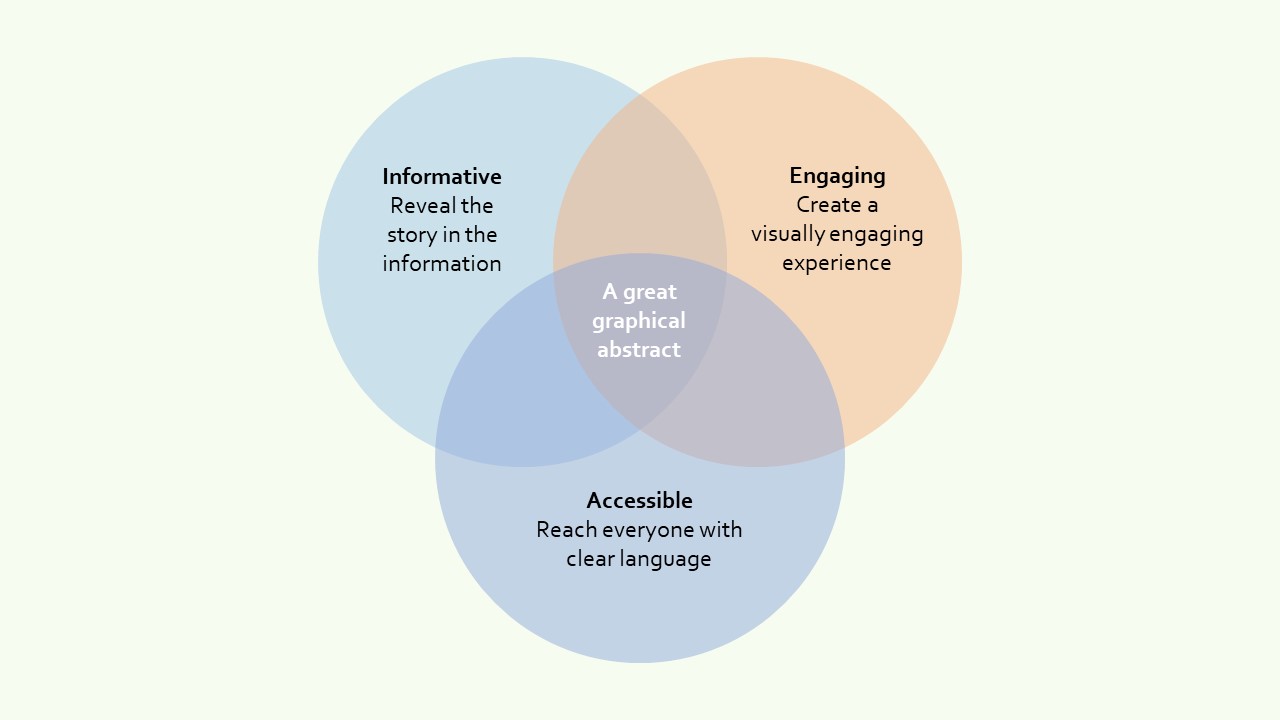
So what makes a great graphical abstract? To make a great graphical abstract you should consider three aspects. First a graphical abstract should be informative. With a graphical abstract you want to convey a message, which should be clear and understandable. But most importantly, you should try to keep focusing on the main message of your paper. A graphical abstract should be engaging. It should catch the eye, so people will get interested in your work and want to know more. And lastly, a graphical abstract should be accessible. A graphical abstract should be aimed at a large audience, so keep the text simple. But also try to remove unnecessary visual clutter, which are elements that could make the graphical abstract confusing.
There are many tools out there that can be used to make a graphical abstract. I think most researchers use PowerPoint for this purpose, which is a useful tool to make a graphical abstract, but has some limitations compared to more specialized software. For instance, it is a bit less flexible with respect to snapping objects to other elements and there are some limitations for saving in different file formats. Alternatives are Adobe Illustrator and Inkscape, which are vector graphics software. Pixel based tools, like Adobe Photoshop, are not useful to make graphical abstracts. My personal favorite is Inkscape, because it is open source and it is accessible enough to make simple diagrams rapidly, although it has a somewhat steep learning curve.
For the purpose of this blog post, I created an example of a graphical abstract related to my research, which I gradually improved (see the animation below). First, I will discuss the initial version (1/5) and tell why it is not qualified for being a great graphical abstract. Let’s go through the three aspects one-by-one. Is it informative? Well, not so much. It shows some information about the relevant processes (soil erosion, discharge, etc.), but the reader does not have a clue what the values in the table represent, probably changes with respect to two different situations, but who knows. Is it engaging? It is somewhat engaging. The hillslope and river clearly show something that catches the eye. But the annotations and the table are somewhat old fashion. Is it accessible? There is some visual clutter, like the use of a table, so this can be improved, as well.
In the animation you can see how I gradually improved the graphical abstract while focusing on the three main aspects of a great graphical abstract. First I changed the colors (2/5), which in the initial version seemed a bit unrealistic. In the improved version I used the colors generated by a color palette generator, in this case the one by Steven deGraeve. I used a photo related to the situation I wanted to schematize, this could be, for instance, a photo of your study area or an experimental set-up. This surely makes it more engaging. Also, because I used some transparency in the water and three different colors for the canopy of the trees. Next (3/5), I changed the annotations and used sans-serif fonts (Nexa), instead of serif fonts (Times New Roman). On top of that, I removed the white background and border and used a transparent background. These simple changes makes the graphical abstract more engaging, as well. To make the graphical abstract more accessible, I removed the table (4/5) and showed the values along with the annotations. It removes some visual clutter and connects the hillslope and channel schematization with the results. Finally (5/5), I added a text block with the conclusion of the study, this makes it much more informative. Now we also know what the values stand for, a change caused by climate change.
I hope that this blog post will encourage you to start making graphical abstracts. From my experience, it becomes much more fun once you start and get familiar with the software. I showed that with a few simple steps you can improve your graphical abstract, making it more informative, engaging and accessible. This will ultimately lead to more interest in your paper, which is the purpose of the graphical abstract in the first place. This blog post is largely a summary of a presentation that I gave during a workshop organized by the IAHS Early Career Committee and the Young Hydrological Society on promoting your research findings to the scientific community.